

Production by type as a stacked bar chart
Find every production type of a price zone, read each one, and stack them by day.
Production by type is one timeseries per type, all sharing the definition
production.realised_output.actual_generation_per_type; the type is the last part of the name
(nuclear, wind_onshore, solar, …).
This example plots France for the last seven days, as the daily average of each type:
Find the types. One search for the definition on the price zone lists every type the provider publishes there.
Read each type. One values call per type, over the same window. A type with no value in the window is left out.
Stack them, one bar per day, the largest type at the bottom.
import os
from datetime import datetime, timedelta, timezone

import matplotlib.pyplot as plt
import pandas as pd
import requests

API = "https://grid.rebase.energy/api/v1"
HEADERS = {"X-API-Key": os.environ["GRID_API_KEY"]}
ENTITY = "FR"  # France has one price zone; for a country with several, repeat per zone and add up
DEFINITION = "production.realised_output.actual_generation_per_type"

today = datetime.now(timezone.utc).replace(hour=0, minute=0, second=0, microsecond=0)
start, end = today - timedelta(days=7), today - timedelta(minutes=15)

# 1. Discover: every production type ENTSO-E publishes for the zone.
r = requests.get(
    f"{API}/timeseries",
    headers=HEADERS,
    params={"entity": ENTITY, "q": DEFINITION, "provider": "entsoe", "limit": 1000},
)
r.raise_for_status()
names = [item["name"] for item in r.json()["items"] if item["name"].startswith(DEFINITION + ".")]

# 2. Read: one call per production type. A type with no value in the window is left out.
daily = {}
for name in names:
    r = requests.get(
        f"{API}/entities/{ENTITY}/timeseries/{name}/values",
        headers=HEADERS,
        params={"provider": "entsoe", "start": start.isoformat(), "end": end.isoformat()},
    )
    r.raise_for_status()
    points = pd.DataFrame(r.json()["points"])
    if points.empty:
        continue
    values = points.set_index(pd.to_datetime(points["valid_time"]))["value"]
    daily[name.rsplit(".", 1)[1]] = values.resample("1D").mean()

# 3. Plot: one bar per day, one segment per type, largest at the bottom.
table = pd.DataFrame(daily).fillna(0)
table = table[table.mean().sort_values(ascending=False).index]
ax = table.plot.bar(stacked=True, figsize=(10, 5), width=0.8, colormap="tab20")
ax.set_xticklabels([d.strftime("%d %b") for d in table.index], rotation=0)
ax.set_xlabel("")
ax.set_title(f"{ENTITY} production by type, daily average")
ax.set_ylabel("MW")
ax.legend(fontsize=7, ncol=2, loc="upper left", bbox_to_anchor=(1, 1))
plt.tight_layout()
plt.show()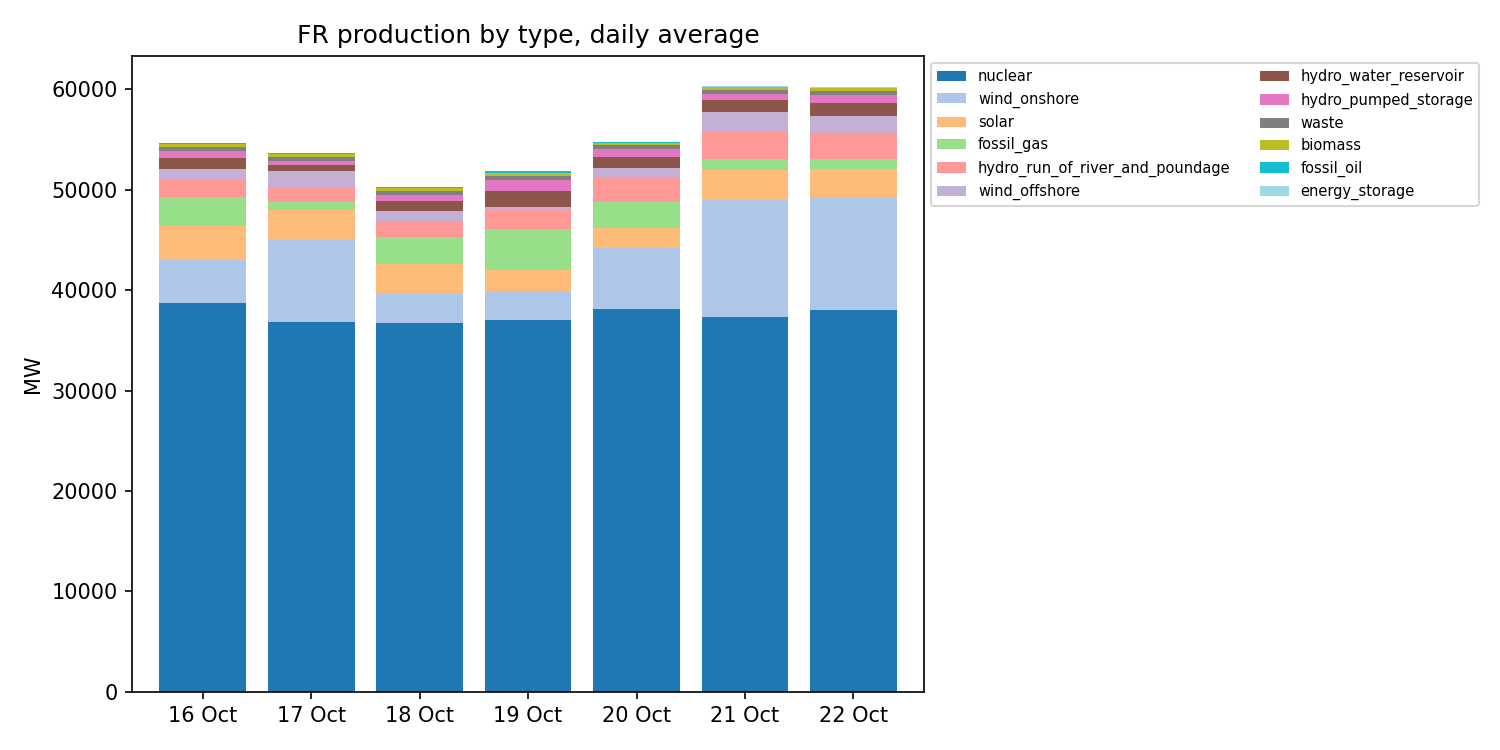
Production by type is published per price zone. France is one price zone; for a country with several (Sweden, Norway, Italy), read each of its price zones, listed as its children in the entity tree, and add them up.
The script is docs-site/examples/production_by_type.py;
it needs requests, pandas and matplotlib, and the key in GRID_API_KEY.