

Plot every version of a forecast
Read a forecast as it was known hour by hour, and draw each version it went through.
A forecast is published, then revised. The API keeps every version, so one call returns the forecast as it stood at each hour, and the versions can be drawn on top of each other.
This example reads Fingrid's day-ahead load forecast for Finland, as published on the ENTSO-E Transparency Platform, for yesterday:
Read one snapshot per hour. as_of=PT1H returns the whole window as it was known at every
hour. The window starts two days before the delivery day, so it also covers the hours when the
forecast was issued and revised.
Keep the versions. From each snapshot keep the delivery day, and drop the snapshots that did not change it: what remains are the versions of the forecast.
Plot them, coloured from the oldest to the newest.
import os
from datetime import datetime, timedelta, timezone

import matplotlib.pyplot as plt
import pandas as pd
import requests

API = "https://grid.rebase.energy/api/v1"
HEADERS = {"X-API-Key": os.environ["GRID_API_KEY"]}
ENTITY = "FI"
NAME = "consumption.load_forecast.day_ahead_total_load_forecast"

# The delivery day is yesterday. The window starts two days earlier, so the snapshots also
# cover the hours before the delivery day, when the forecast was issued and revised.
day = datetime.now(timezone.utc).replace(hour=0, minute=0, second=0, microsecond=0) - timedelta(days=1)
start, end = day - timedelta(days=2), day + timedelta(days=1)

# One snapshot per hour: each is the whole window as it was known at that hour.
r = requests.get(
    f"{API}/entities/{ENTITY}/timeseries/{NAME}/values",
    headers=HEADERS,
    params={
        "provider": "entsoe",
        "start": start.isoformat(),
        "end": end.isoformat(),
        "as_of": "PT1H",
        "max_snapshots": 1000,
    },
)
r.raise_for_status()

# Keep the delivery day from each snapshot, and only the snapshots that changed it: those are
# the versions of the forecast.
versions = []
for snapshot in r.json()["snapshots"]:
    points = pd.DataFrame(snapshot["points"])
    points["valid_time"] = pd.to_datetime(points["valid_time"])
    points = points[(points["valid_time"] >= day) & (points["valid_time"] < day + timedelta(days=1))]
    if points.empty:
        continue
    series = points.set_index("valid_time")["value"]
    if versions and series.equals(versions[-1][1]):
        continue
    versions.append((snapshot["as_of"], series))

fig, ax = plt.subplots(figsize=(10, 5))
colors = plt.cm.viridis([i / max(len(versions) - 1, 1) for i in range(len(versions))])
for (as_of, series), color in zip(versions, colors):
    ax.plot(series.index, series.values, color=color, linewidth=1.2, label=f"as of {as_of[5:16]}")
ax.set_title(f"{ENTITY} day-ahead load forecast for {day:%Y-%m-%d}: {len(versions)} versions")
ax.set_ylabel("MW")
ax.legend(fontsize=7, ncol=2)
fig.tight_layout()
plt.show()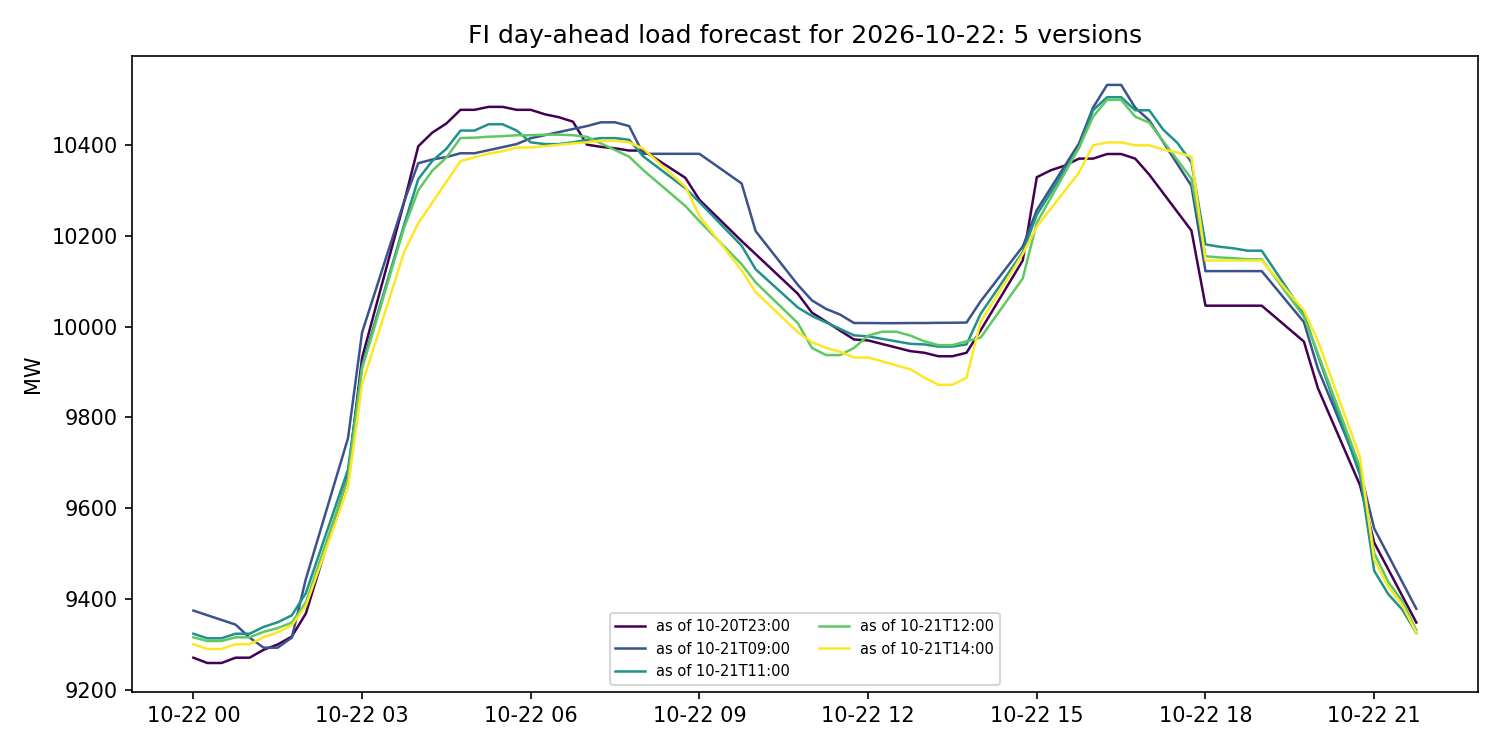
Version history starts when the collection of a series starts, so the earliest delivery day with
versions is 3 September 2026. For the snapshot forms of as_of, see
Reading values.
The script is docs-site/examples/forecast_versions.py;
it needs requests, pandas and matplotlib, and the key in GRID_API_KEY.